Three key elements to pay attention to when assessing prices and the real estate market.
 As we round out the first quarter of 2023, three real-time trends to pay close attention to in order to truly understand what is happening in the real estate market are absorption data, interest rates, and inventory levels. Right now, we are in the midst of the market heating up due to seasonality, pent-up buyer demand, and rates finding their new normal. The media will often lag in reporting the latest information (pending sale data) and will latch onto closed sale data, which is outdated. I am here to keep you on the frontline of market activity so you are connected to the most current data to keep you well informed.
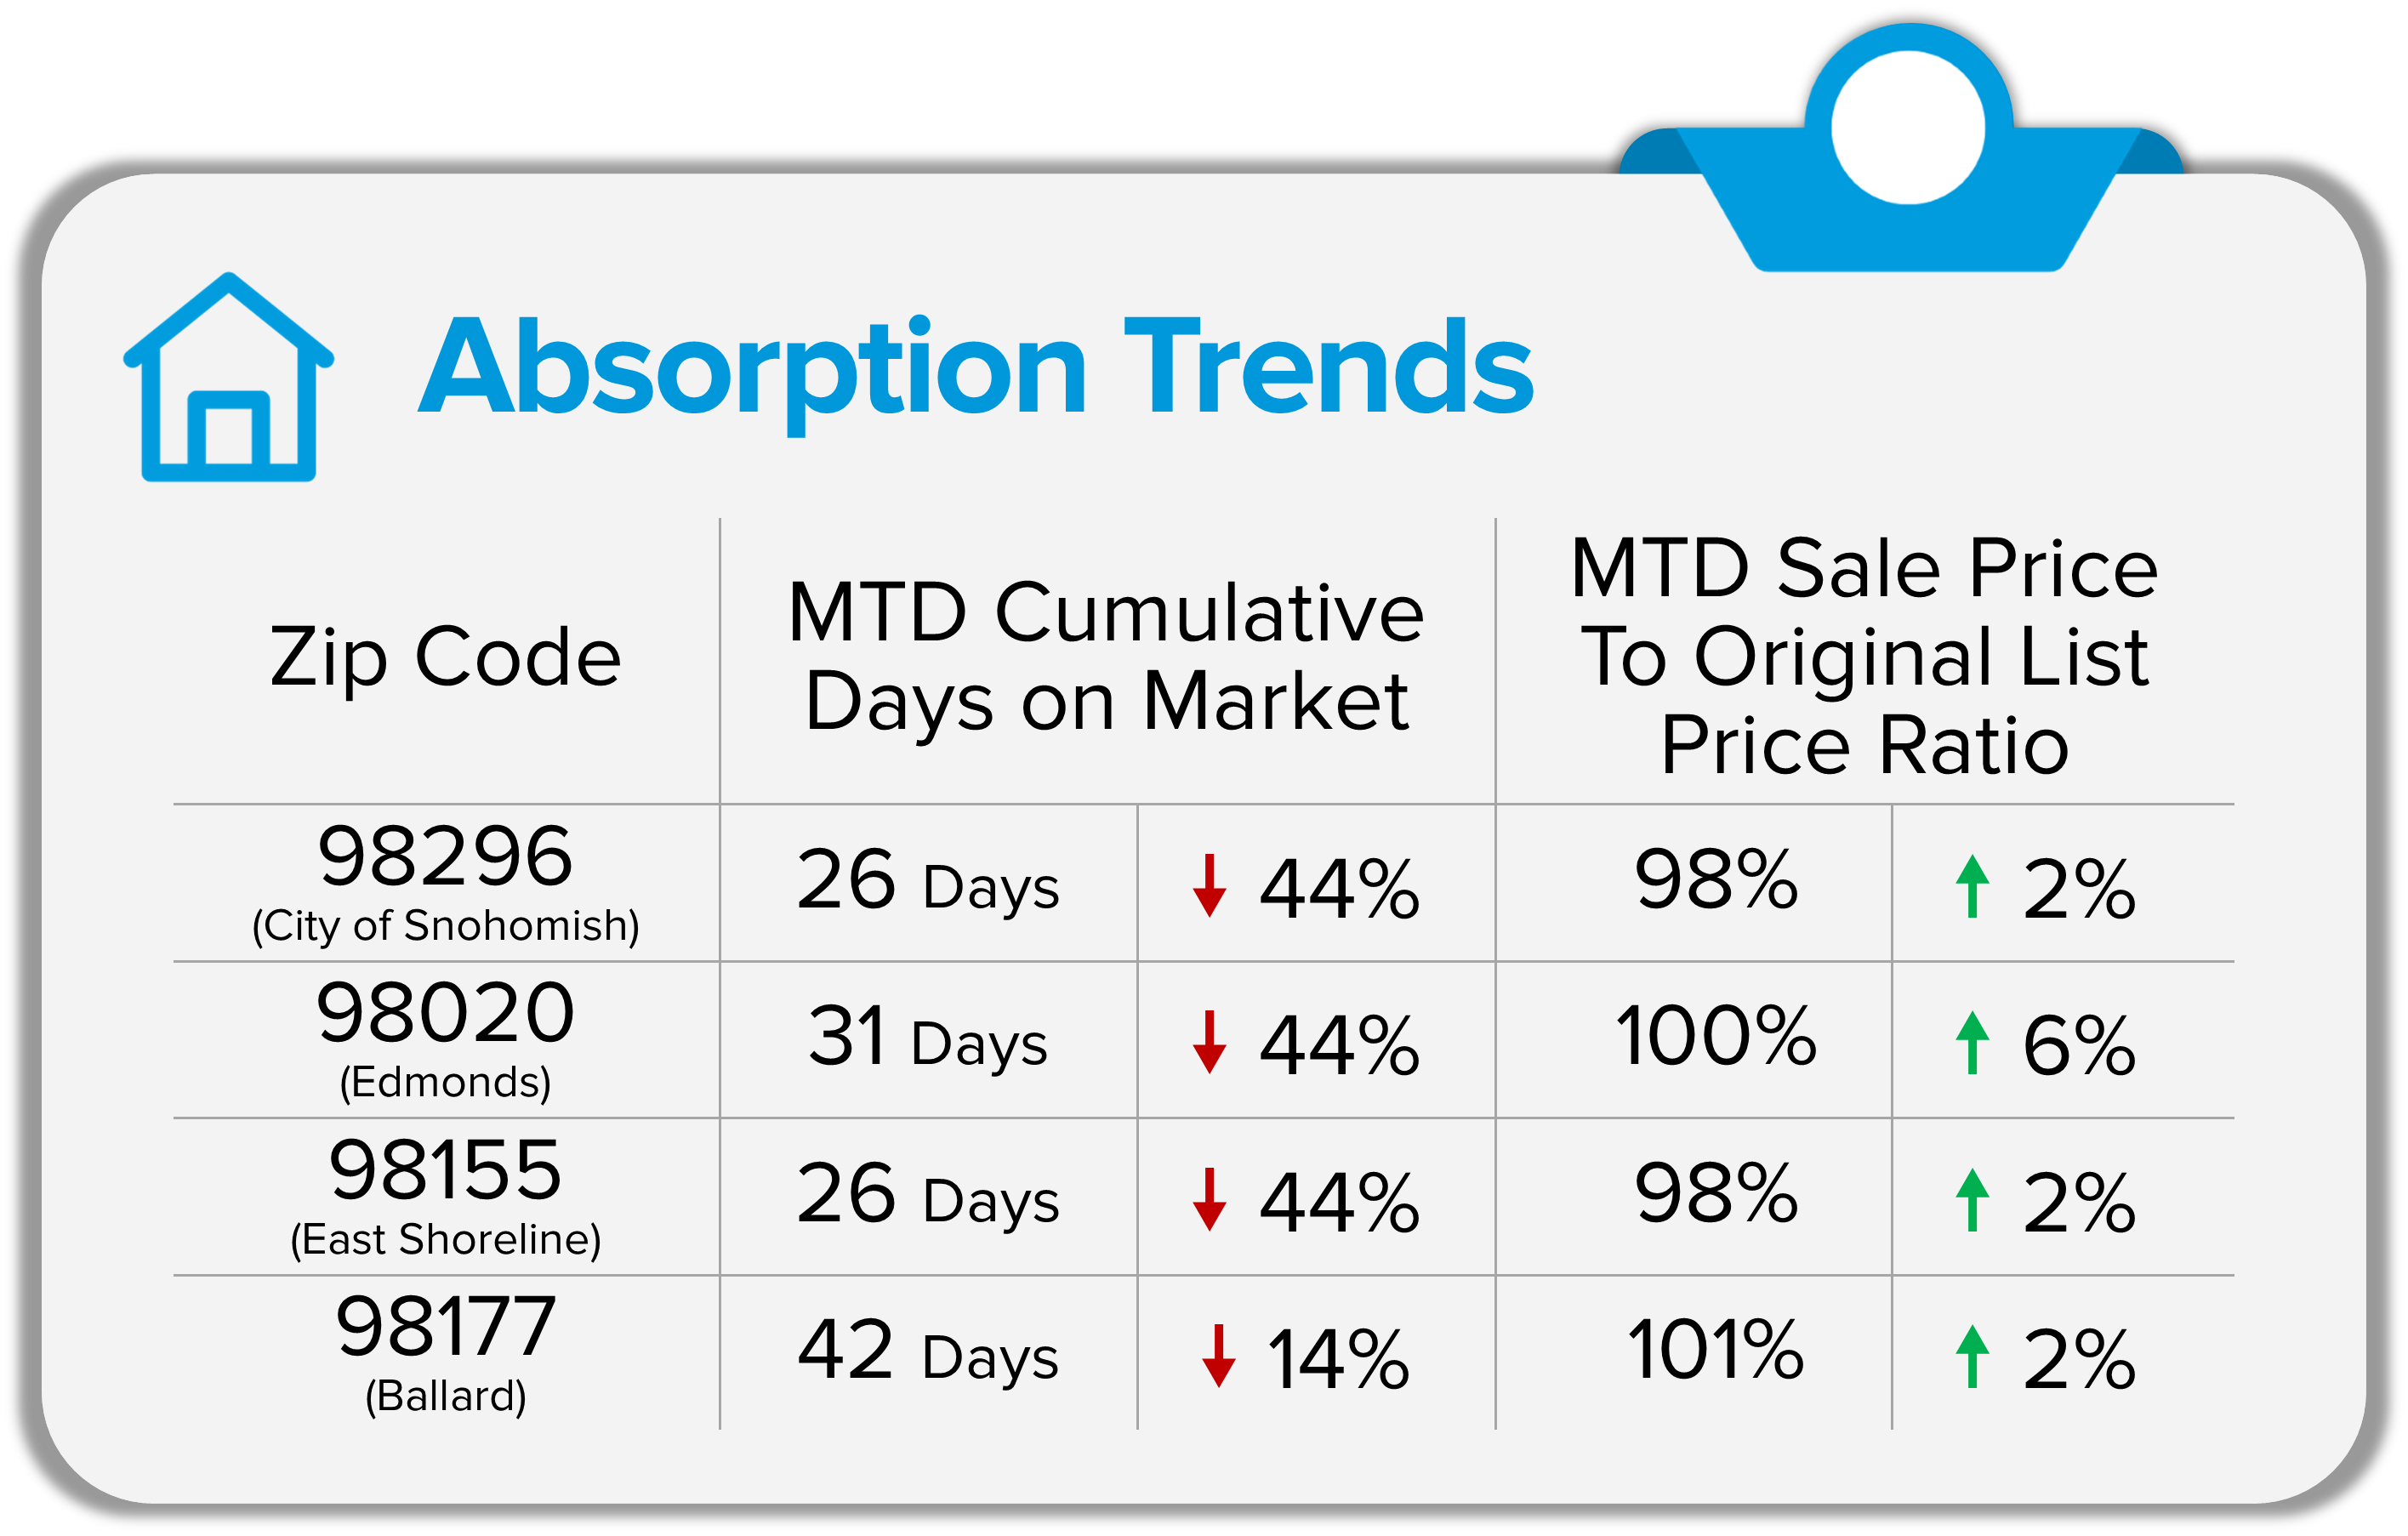
Let’s start with absorption data. Month-to-date (3/1/23-3/27/23), days on market are shrinking and sale price to original list price ratios are climbing. This means that houses are selling faster and negotiations are becoming more competitive for buyers. I was able to determine that these trends are fluid from Snohomish County to King County by analyzing four zip codes: 98296 (City of Snohomish), 98020 (Edmonds), 98155 (East Shoreline), 98117 (Ballard).
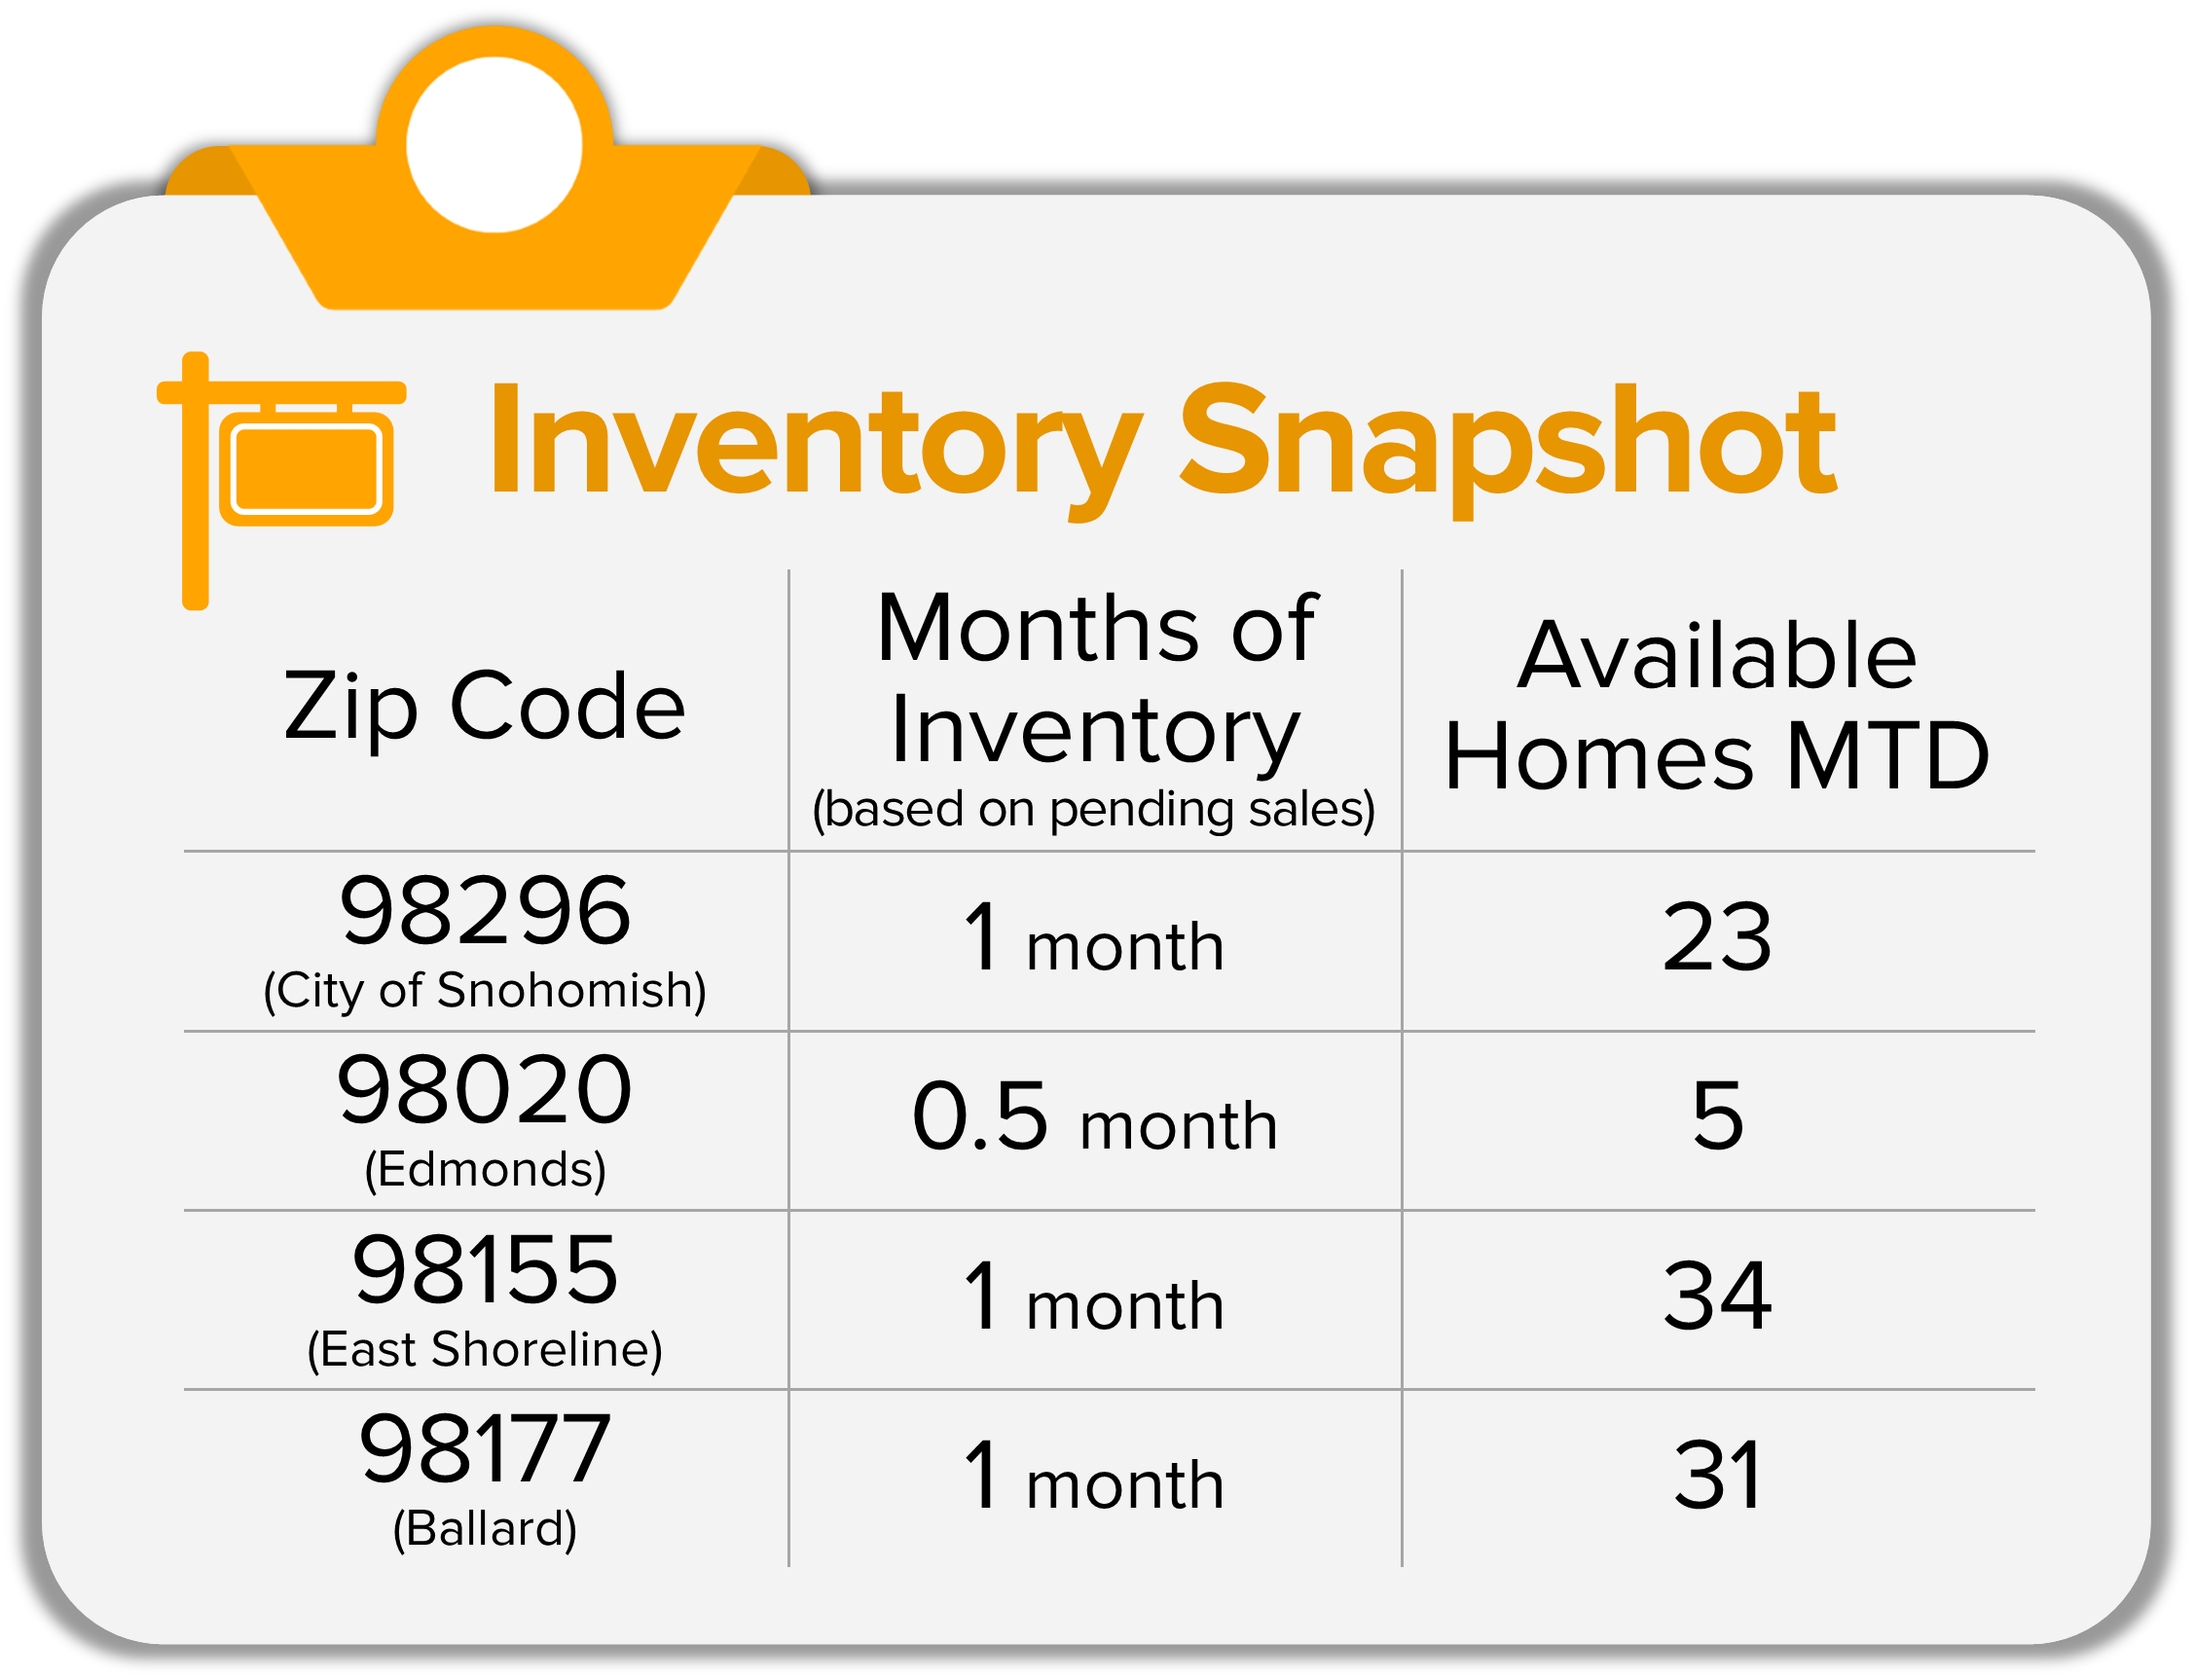
 Available inventory is constricting due to an increase in absorption and new listings lagging. As we head into spring, we will see a seasonal uptick in new listings which will be welcomed by a healthy buyer audience. Month-to-date, inventory levels based on pending sales show a seller’s market (0-2 months). You calculate months of inventory by taking the number of available homes and dividing it by the number of pending sales. If no new homes came to market the trend suggests we would sell out of homes in this amount of time. Month-to-date the actual number of homes available in each zip code is quite limited and a welcome sign for more new listings as we head into Spring. Again, I pulled the data for the four zip codes to represent a sampling of both Snohomish and King Counties.
Both of the trends above have been determined by buyers becoming more comfortable with the new normal of interest rates. The correction in the market that we experienced in 2022 was a result of a 3-point increase in interest rates. After prices adjusted to levels that would work with the higher rates, buyers started to return to the market. 2-3% and maybe even 4% interest rates will be folklore we tell our grandchildren about. People that want to make a move have come to terms with adapting to the higher rates and making these important life transitions. Today’s rates are much more in line with the average over the last 30 years.
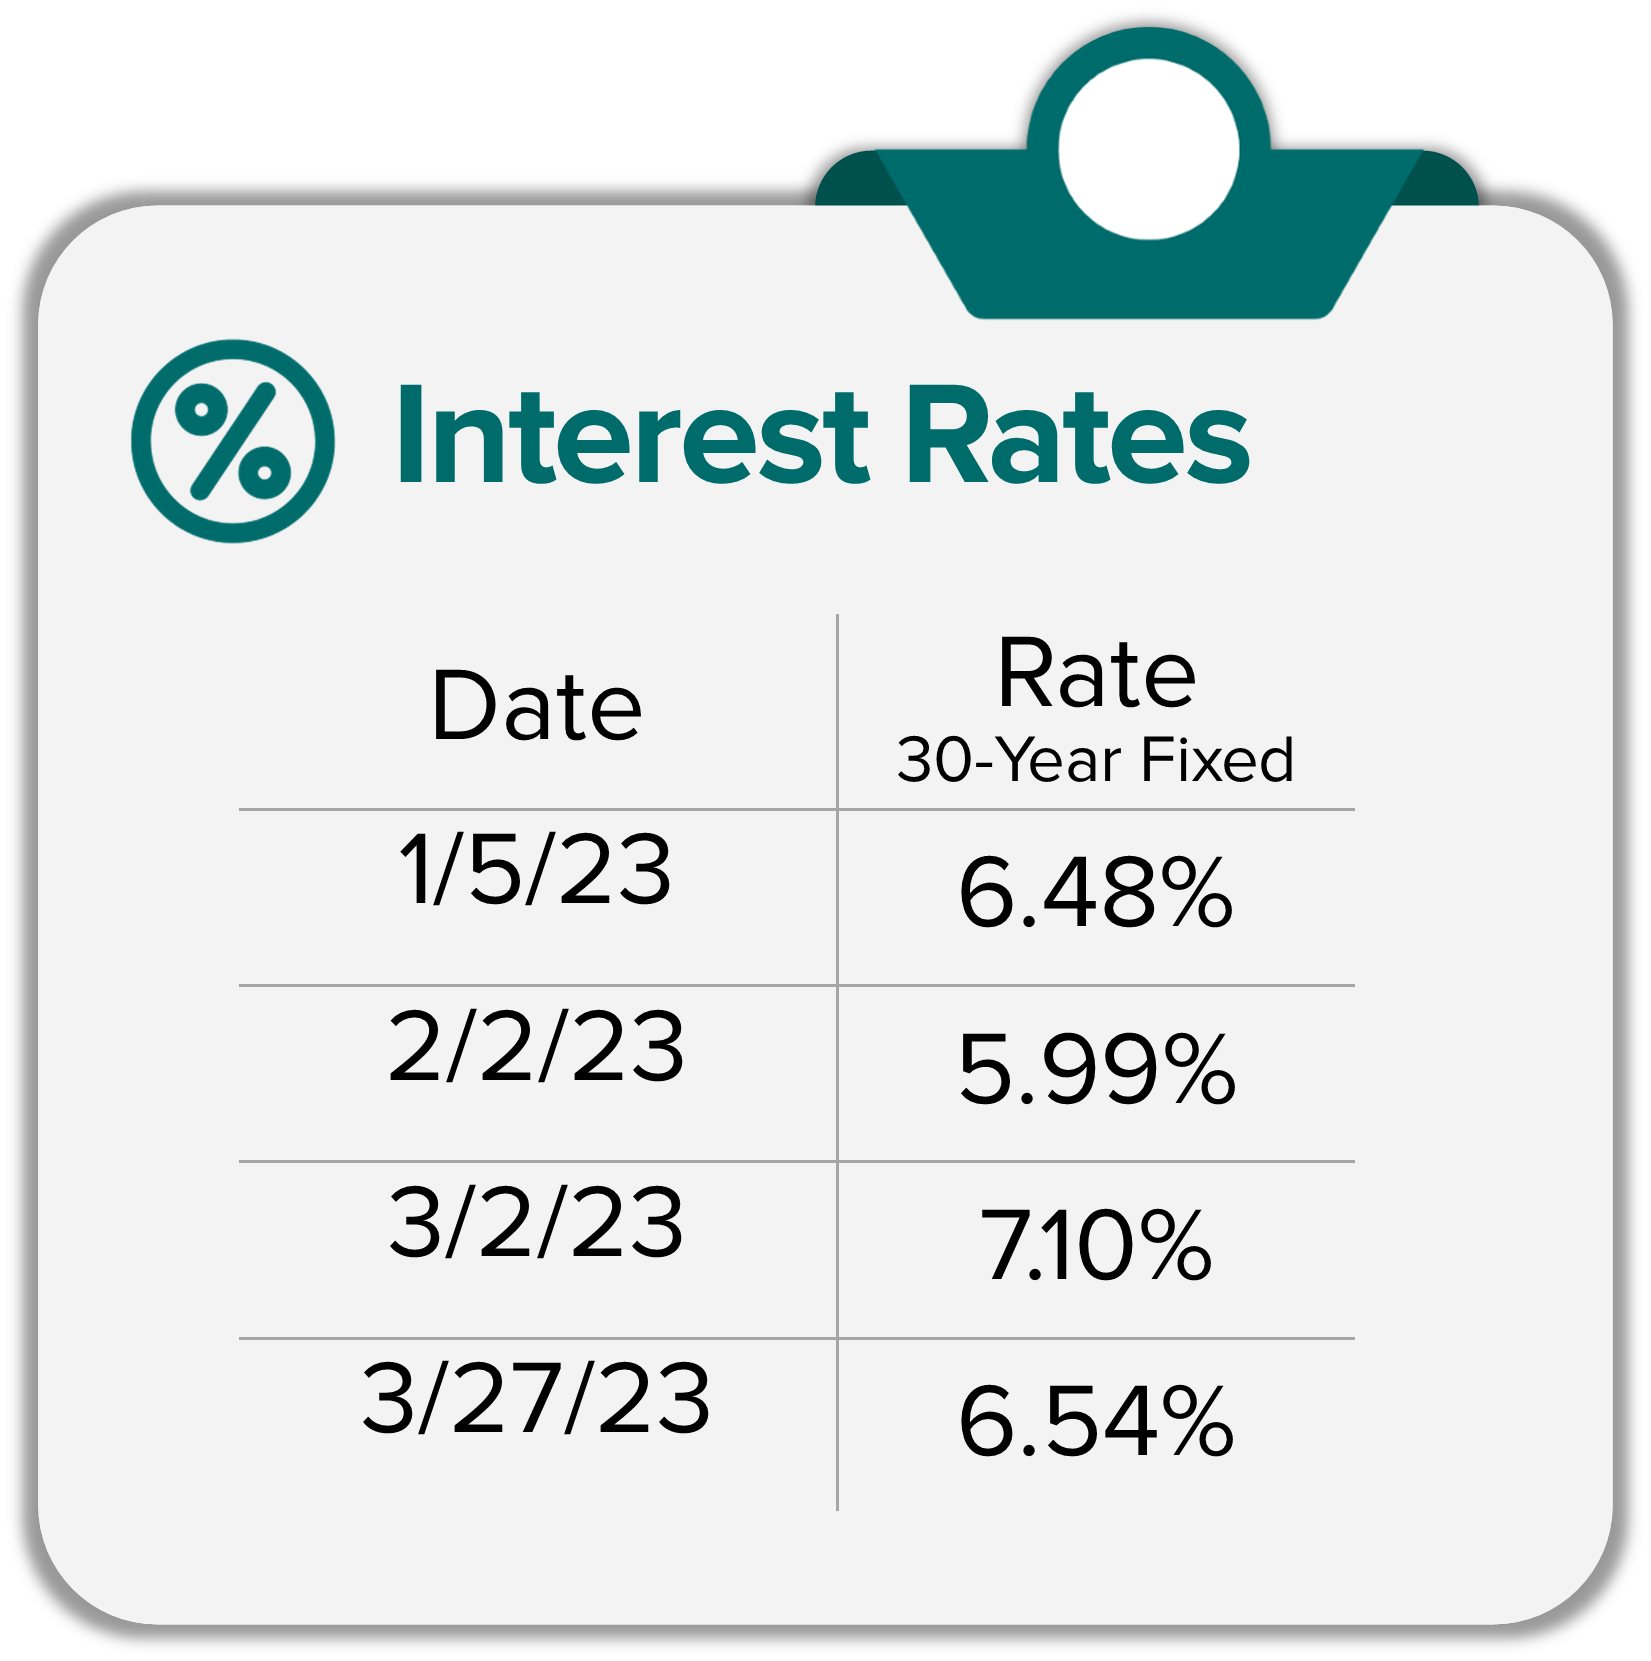
 At the start of 2023, the 30-year fixed mortgage was at 6.48%, then dropped to 5.99% in early February, peaked at 7.1% in early March, and is now back down to 6.54% at press time. Rates have been volatile as the Fed tries to manage inflation. You can access a video below from Matthew Gardner explaining the effect of the Fed and the recent bank failures on interest rates and the real estate market overall.
One item to note is that mortgage rates are long-term interest rates, and when you hear about the Fed raising rates they are referring to short-term rates such as car loans, credit cards, and home equity loans. The media does not make that distinction, often confusing the public. In fact, in some cases when the short-term rate has been increased, we have seen mortgage rates drop. Here is a great website to follow to get a real-time read on rates.
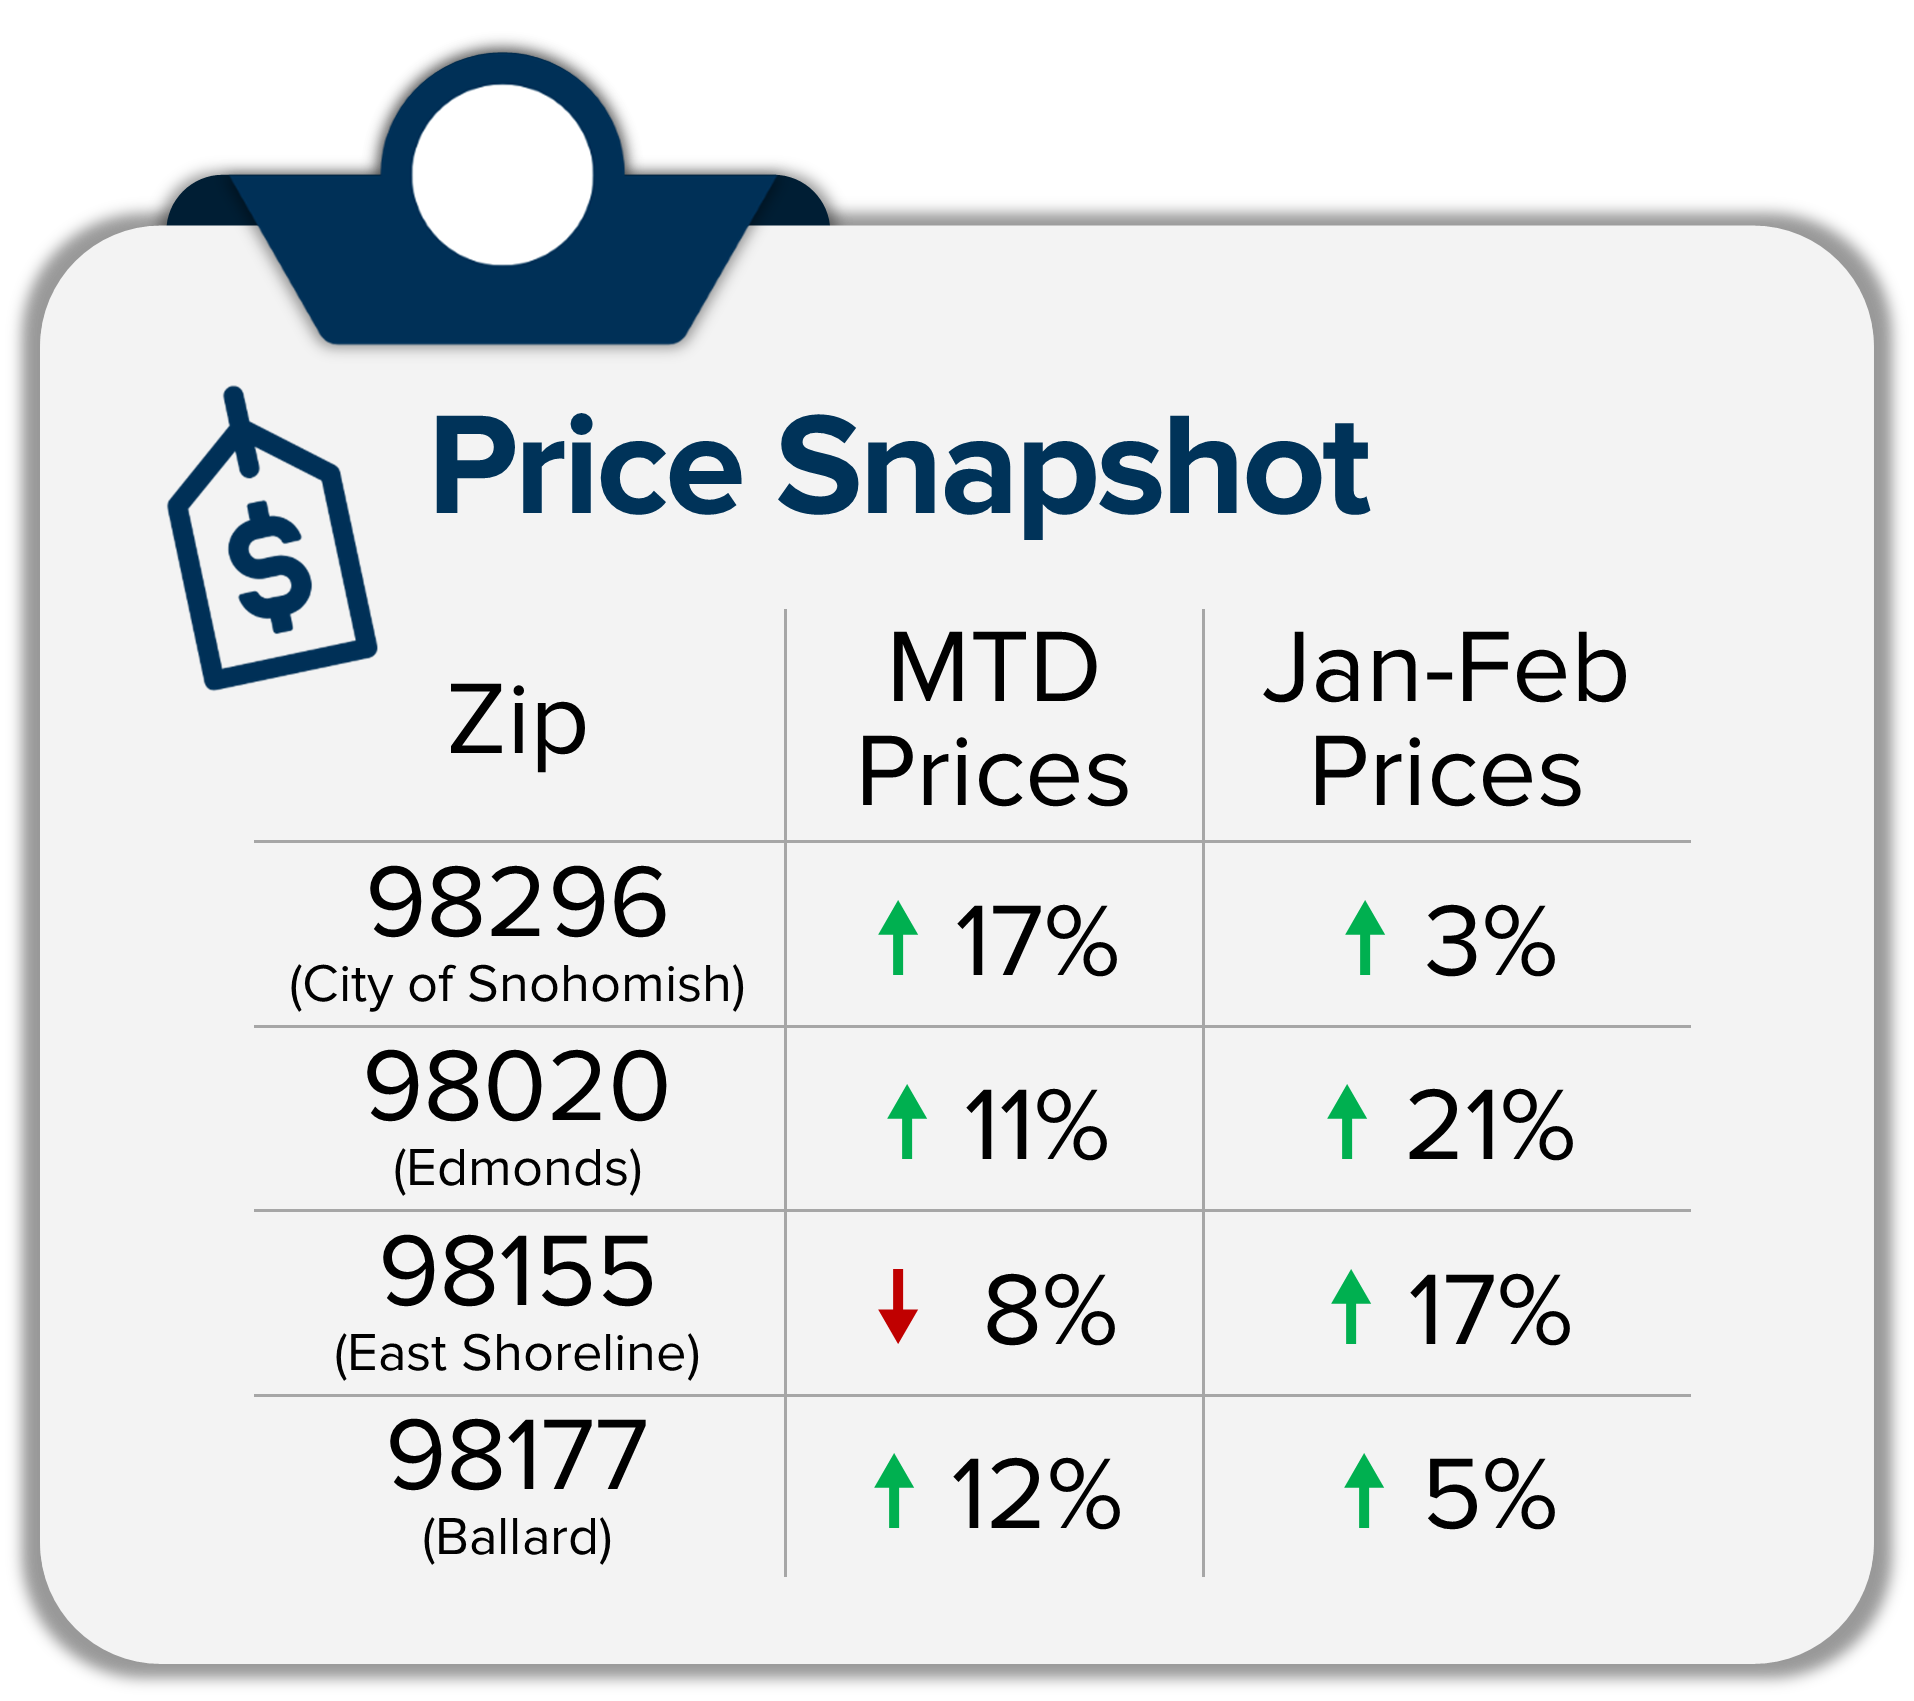
Interest rates finding their way, the psychological acceptance of the new normal, and people needing to make moves to adapt to their life changes have led to prices starting to stabilize and even grow in some markets. I pulled the month-to-date median price data for the four zip codes and it appears prices are leveling and growth is happening or will be in the near future. Bear in mind, that the bottom often comes in the form of a bounce before there is a consistent straight shot up. All signs are pointing to recovery from the correction in these areas noted. This growth will be added to the immense long-term price gains we have seen. Currently, 93% of all homeowners in the U.S. have positive home equity and 48% of homeowners have more than 50% equity.
 During this time of change, it is important that each neighborhood and price point is researched individually. From the four zip code breakdowns above, it is clear that the trends vary. When I am asked the question, “How’s the Market?”, I am always curious to know what you have heard and what you want to learn about. Sweeping statements are dangerous and I am committed to diving into the data to educate my clients on how the trends affect their investments and their lifestyle.
With the market correction of 2022 in the rearview mirror and the recovering market of 2023 upon us it is important to understand that opportunity abounds. That opportunity is rooted in research. Solid research and discerning the data gathered help empower strong decisions and build trust. This is my process and my passion and it is all about helping people! If you are curious about how the latest trends match up with your investment and lifestyle goals, please reach out and we can dive in.
 You’re invited to our annual Paper Shredding Event & Food Drive. We partner with Confidential Data Disposal to provide a safe, eco-friendly way to reduce your paper trail and help prevent identity theft.
Saturday, April 15th, 10AM to 2PM*
4211 Alderwood Mall Blvd, Lynnwood
Bring your sensitive documents to be professionally destroyed on-site. Limit 10 file boxes per visitor.
This is a paper-only event. No x-rays, electronics, recyclables, or any other materials.
We will also be collecting non-perishable food and cash donations to benefit Volunteers of America Western Washington food banks. Donations are not required, but are appreciated. Hope to see you there! *Or until the trucks are full
 Facebook
 X
X
 Pinterest
 Copy Link
